Data Visualization2026
- Product Analytics
- Insight Generation
- Power BI
- SQL
- DAX
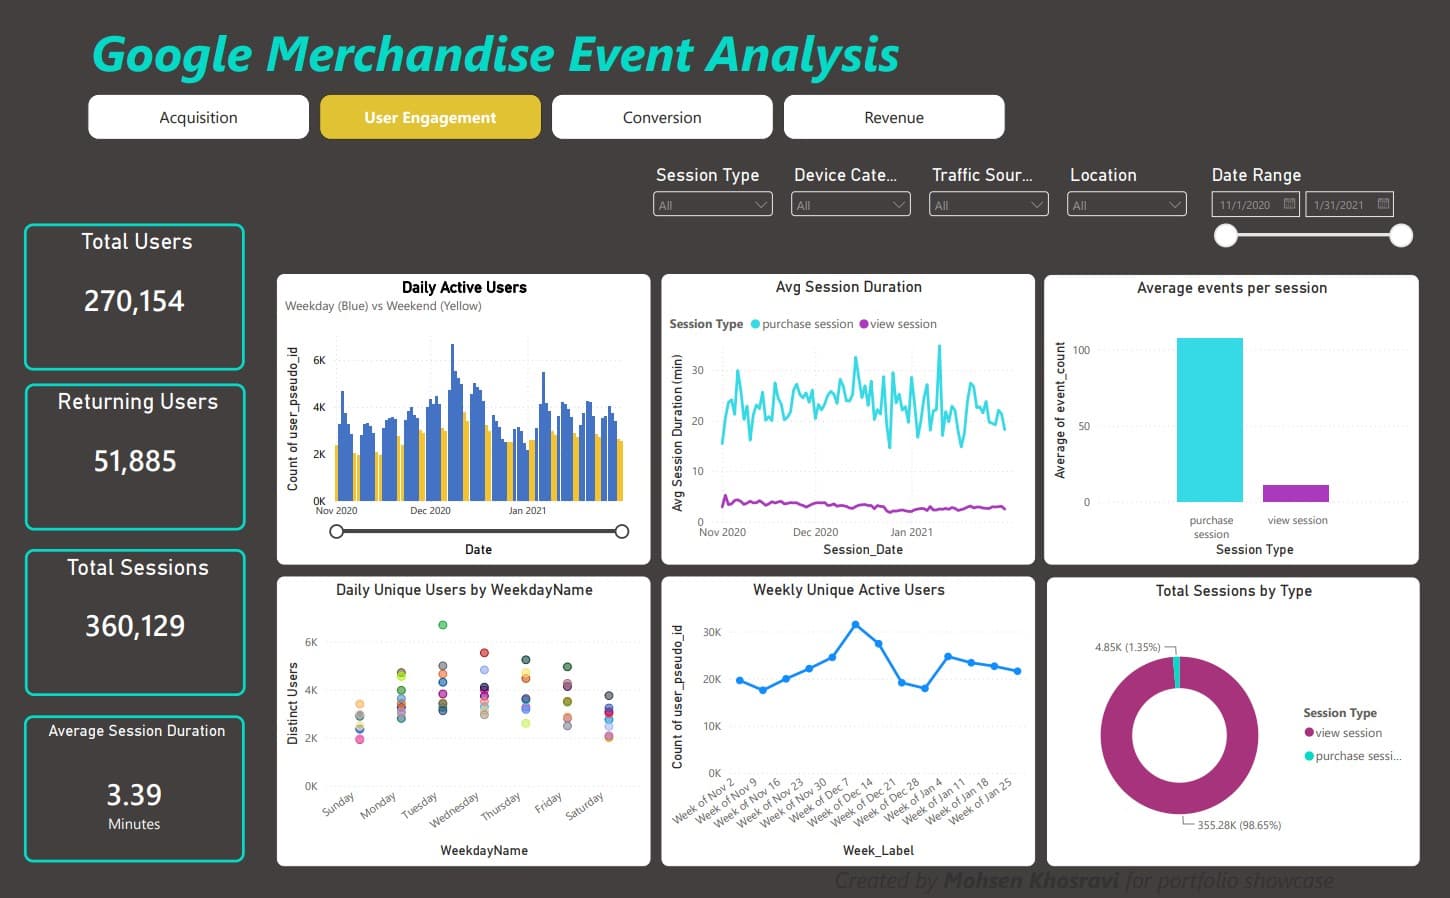
Google Merchandise Store Power BI Dashboard
Sample visualization project using publicly available data from GA4 on BigQuery

This portfolio is about how I think. The projects show what I can do, yet the most useful thing I bring to a team is how I approach problems and work with others. Here you’ll find examples of structured thinking, measurable impact, collaboration, and analytical rigor.
If this resonates, I’d love to connect.
Sample visualization project using publicly available data from GA4 on BigQuery
Rahnema
Rahnema, Iran's dominant music distributor, faced forecasted revenue pressure as the Rial collapsed. Domestic platforms were saturating. The company needed a new revenue channel for mid-term growth.
The Persian-speaking diaspora represented millions of underserved users on YouTube, generating ad revenue no Iranian distributor had systematically captured. The opportunity was large and largely untapped.
I identified the opportunity, built the business case, and led the build from a single test channel to an eight-channel operation. I defined content strategy, built operational infrastructure across legal, finance, design, and support, and optimized revenue through data-driven analysis of YouTube Analytics.
300K+ subscribers, 9M monthly views, tens of thousands of dollars in monthly recurring revenue, 200%+ income growth for three consecutive months, all within 18 months.
Polymer Production Company (proprietary, name withheld)
The demand forecasting process relied on a manual, judgment-based method with little analytical foundation. Forecasts were unreliable and changed frequently.
Unreliable forecasts cascaded into the entire operation. Production plans changed constantly, raw material orders were disrupted, and the business held excess inventory of both raw materials and finished goods to buffer against uncertainty. The cumulative cost was significant.
I led a structured, data-driven redesign of the forecasting method. Starting with five years of actual shipment data, I segmented customers and products by demand behavior, tested multiple averaging windows, and identified that a six-month rolling average consistently minimized forecast variance. I validated the method on held-out data, incorporated customer-provided signals for exceptions, and applied growth and decline rates for non-stable segments.
Demand accuracy reached and sustained above 90% within three months. Product changeovers on production assets, each costing over $100K, were significantly reduced. This work contributed approximately $1M of a broader $2M savings initiative in material ordering and demand forecasting.
Manufacturing & Packaging Operation (proprietary, name withheld)
A manufacturing operation had no visibility into what was driving carton rework. The source system deleted the original carton record every time a repack occurred, permanently severing the link between a carton and the quality event that caused its rework.
Repack work always lost the capacity fight against new production, creating a growing backlog. Backlogged cartons meant held inventory and tied-up cash. Teams also defensively over-repacked cartons to be safe, wasting capacity on unnecessary rework.
I traced the missing lineage back through the system's own audit log and built logic to reliably extract quality event data from it. I designed a relational data model connecting cartons, components, and quality events, built an ETL pipeline with server-side filtering for fast refreshes, and layered in DAX logic guaranteeing every repacked carton is accounted for.
Reduced rework by 50% within 2 months. Reduced time to ship by 70% within 6 months. Gave Operations and Quality leadership their first real visibility into repack root causes.