- Product Analytics
- Insight Generation
- Power BI
- SQL
- DAX
Google Merchandise Store Power BI Dashboard
Sample visualization project using publicly available data from GA4 on BigQuery
Visuals
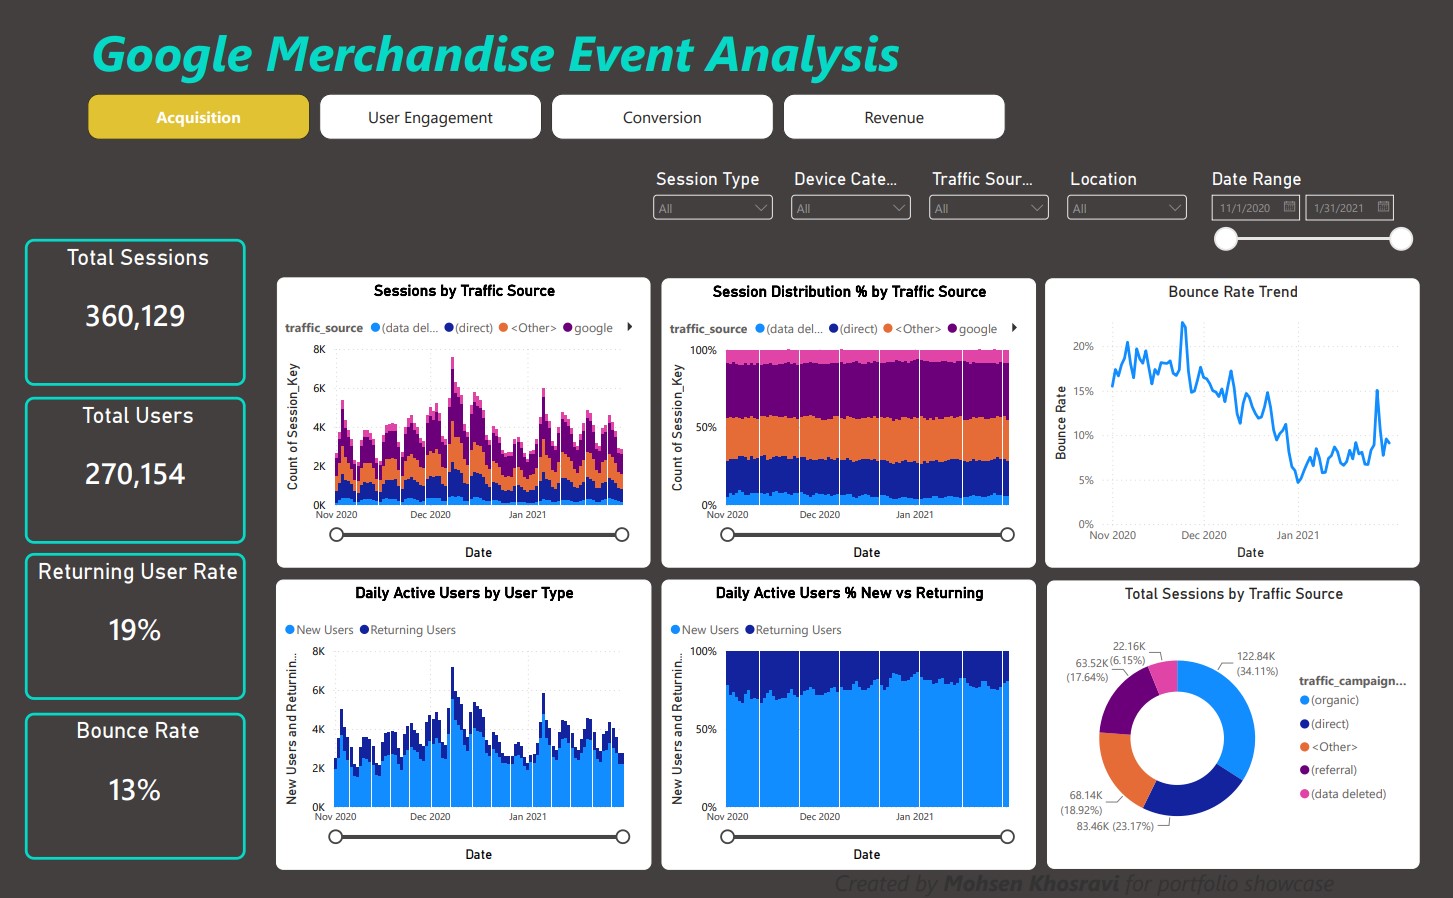
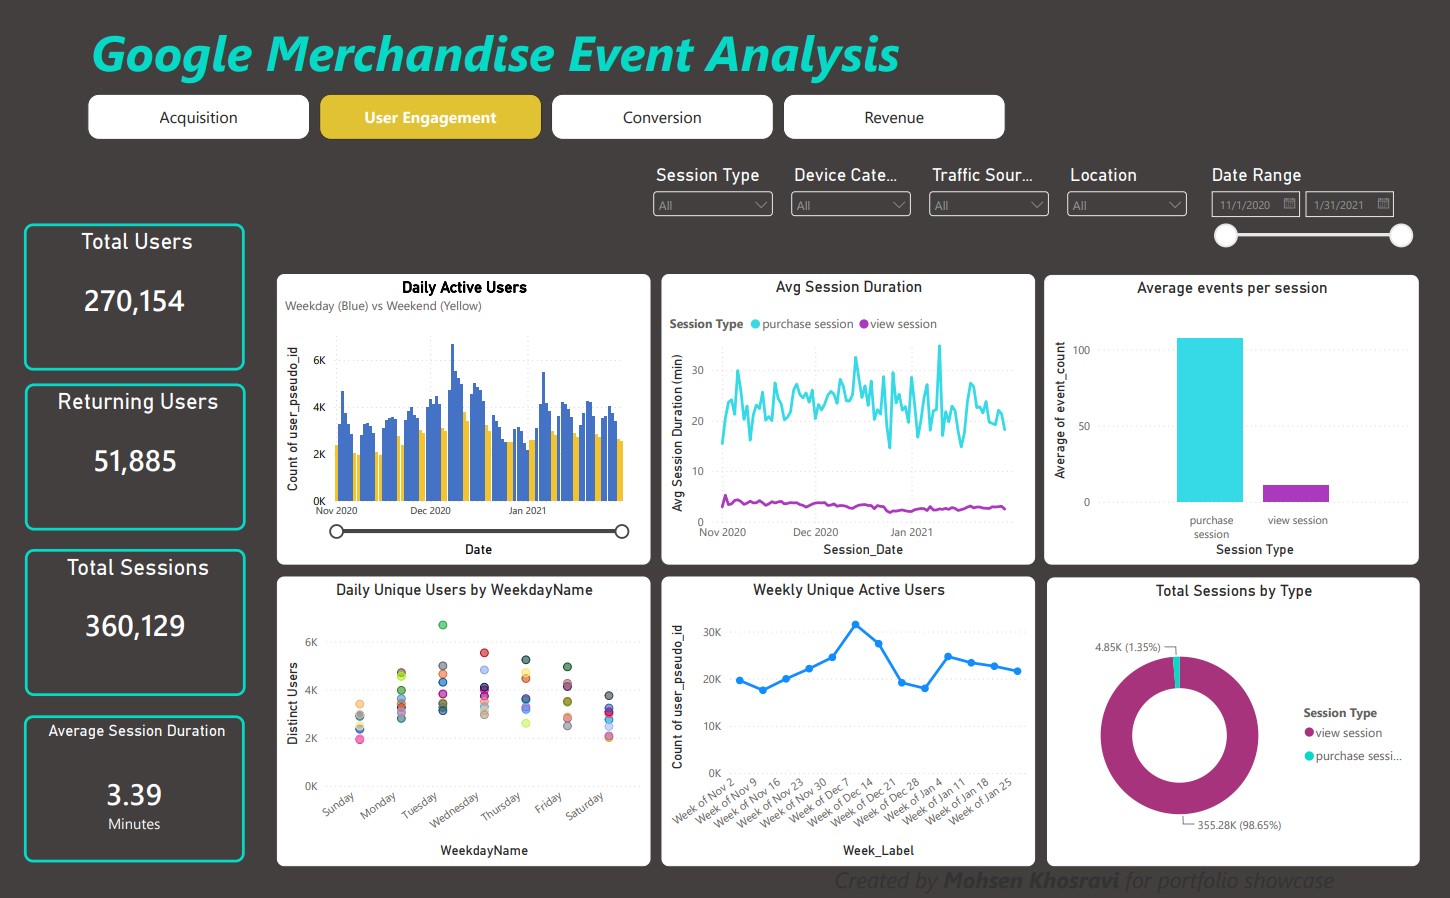
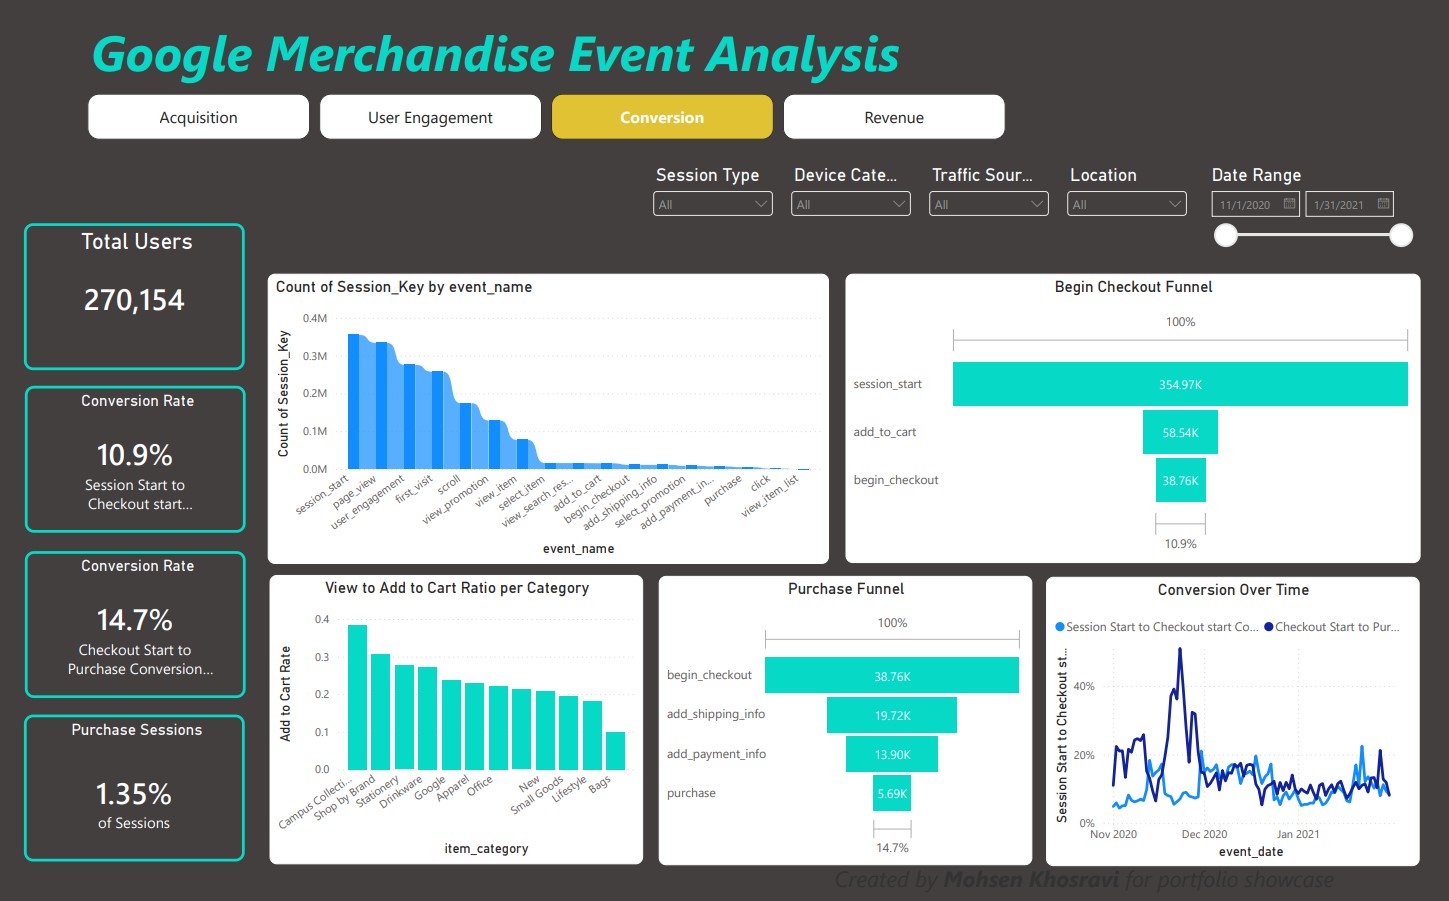
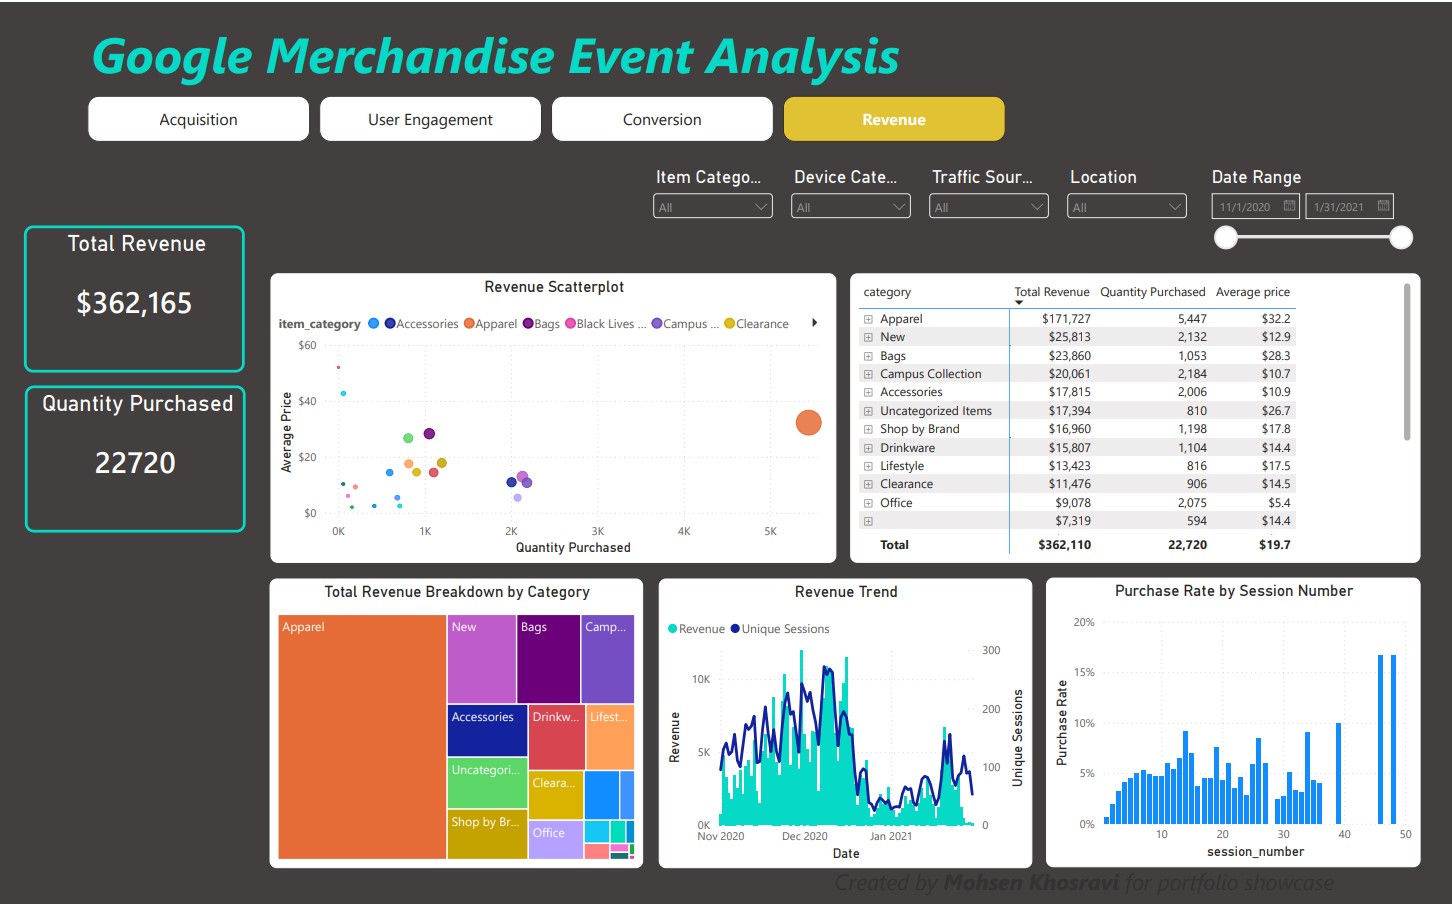
Overall Purpose and Stakeholder Analysis
The report uses 3 months (November 2020 to January 2021) of detailed event data from the Google Merchandise Store to evaluate how the users arrive, engage, convert and spend. The visuals present the key business metrics and trends, and answer key user behavior and journey questions.
Four stakeholder groups shaped the metrics. The report pages follow the journey stages, and each group's main question is answered on one or more of them.
| Stakeholder | What they want from this data | Level of aggregation | Key metrics |
|---|---|---|---|
| UX / Site Experience | Where users drop off in the journey; how session behavior (duration, bounce) signals friction | Session-level, funnel-step level | Bounce rate, avg. session duration, funnel conversion by step (view → cart → checkout → purchase), event count per session |
| Marketing / Acquisition | Which channels and devices drive engaged, converting traffic, which channels drive user acquisition | Daily/weekly, by traffic source and device | Sessions by traffic source, new vs. returning users, sessions by device category, purchase rate by channel |
| Merchandising / Product Category | Which categories draw interest vs. which convert to revenue; where attention and purchase diverge | By product category, full reporting window | Revenue by category, quantity purchased vs. viewed by category, item-level funnel conversion |
| Executive / Leadership | A fast, trustworthy read on overall site health and revenue performance | Period-level summary (monthly or full window) | Total revenue, total active users, returning user rate, total sessions, revenue trend over time |
ETL Process
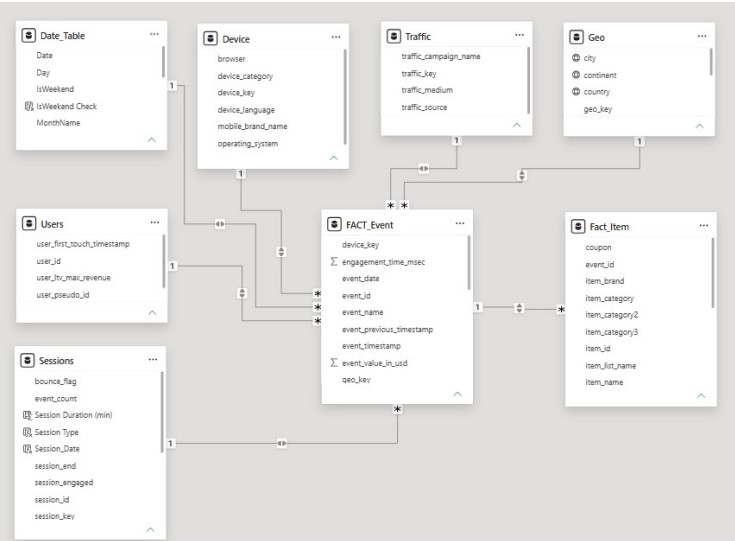
The data moves from a public BigQuery export into a Power BI star schema in three steps.
Data source
Google's GA4 obfuscated sample ecommerce dataset for the Google Merchandise Store (bigquery-public-data.ga4_obfuscated_sample_ecommerce), covering 1 November 2020 to 31 January 2021. It holds 4,295,584 events from 360,129 sessions and 270,154 users. Access came through a BigQuery sandbox project.
Transformation
The raw export stores one row per event, with nested fields for event parameters and items. BigQuery native SQL queries reshape it into analysis-ready tables:
- FACT_Event: one row per event, with keys to the dimension tables.
- Fact_Item: item-level rows linked to events by event ID, holding category, price, quantity and revenue.
- Sessions: one row per session, pulled directly from BigQuery, with session start and end, event count, and engagement and bounce flags.
- Users, Device, Traffic and Geo: dimension tables. Device, Traffic and Geo have no natural ID in the source, so each gets a surrogate key built with an MD5 hash.
- Date_Table: calendar attributes such as weekday or weekend and month name.
Loading
Power BI runs the queries as native BigQuery queries (M with Value.NativeQuery) and loads the results into a star schema. FACT_Event sits at the centre, the dimension tables connect to it in one-to-many relationships, and Fact_Item links to it by event ID. DAX measures calculate the report metrics, and a few columns in Sessions (session type, session duration and session date) are derived in the model.
Insights
Analyzing the visuals provides the following insights
- Traffic and revenue peaked during the holiday shopping season and fell sharply around Christmas, a pattern that matches general consumer shopping behavior.
- This trend holds across geographic regions, traffic sources, and device types.
- Bounce rate was also high during the peak traffic period. Since most competing platforms run promotions during the holiday shopping season and the urge to buy is strong, I have two hypotheses for the higher bounce rate:
- Hypothesis 1: Bounced users came for a specific item rather than exploring the website.
- Hypothesis 2: Bounced users were looking for promotions on the main page.
- Daily active users are consistently higher on weekdays than on the weekends that follow. Analyzing session hours would show whether most visits happened during or outside work hours. This requires converting the current UTC timestamps to regional time, which I have left for later to save time.
- The average session duration (ASD) is 24 minutes for purchase sessions, significantly longer than the 3 minutes for all other sessions (view sessions). This points to opportunities to streamline the purchase journey:
- Offer saved payment options such as Apple Pay or Google Pay to skip the card entry step.
- Make it easier to compare products.
- The largest drop in the purchase funnel occurs between adding payment info and clicking the purchase button (59%).
- The second largest drop in the purchase funnel occurs between starting checkout and adding shipping information (49%).
- The largest drop in the overall user journey occurs between viewing an item and adding it to the cart (80%). This drop is largest for bags (95%) and smallest for campus collections (62%).
- The conversion rate from checkout start to completed purchase peaked between Nov 20 and Nov 24. It is worth checking whether a campaign was running during that period.
- The purchase rate rises gradually from the first session to the seventh. This points to an opportunity for retargeting campaigns aimed at users who did not purchase in their first one to three sessions.
- It is worth examining the time between sessions leading up to a purchase session to find the turning point after which the probability of a purchase declines.
Appendix
Metric definitions
| Metric | Definition |
|---|---|
| Total sessions | Distinct sessions (session key) in the selected filters |
| Total users | Distinct user_pseudo_id values in the selected filters |
| New users | Users in their first-ever session (session_number = 1) |
| Returning users | Distinct users with a session where session_number > 1 |
| Returning user rate | Returning users divided by total users |
| Engaged sessions | Sessions flagged as engaged in the GA4 export (session_engaged) |
| Bounce rate | Non-engaged sessions divided by total sessions. A GA4 session is engaged if it lasts longer than 10 seconds, has a key event or has 2 or more page views |
| Purchase sessions | Sessions that include a purchase event, as a share of all sessions (1.35%) |
| Session start to checkout start | begin_checkout events divided by session_start events (38.76K / 354.97K = 10.9%) |
| Checkout start to purchase | purchase events divided by begin_checkout events (5.69K / 38.76K = 14.7%) |
The two conversion rates on the Conversion page are ratios of event counts. One session can fire begin_checkout several times, so these rates differ from the same ratios counted in distinct sessions.
Metrics Map
Every metric in the report is tied to the stakeholders who use it, the level it is aggregated at and the question it answers.
| Metric | Page | Stakeholders | Aggregation level | Question answered |
|---|---|---|---|---|
| Total sessions (360,129) | Acquisition, User Engagement | Marketing, Executive | Full period, filterable by session type, device, source, location and date | How much traffic did the store receive? |
| Total users (270,154) | Acquisition, User Engagement, Conversion | Executive, Marketing | Full period, filterable | How many distinct visitors were active? |
| Sessions by traffic source | Acquisition | Marketing | Daily, by traffic source (volume and share of sessions) | Which channels drive session volume, and how is the mix shifting? |
| New vs. returning users and returning user rate (19%) | Acquisition, User Engagement | Marketing, Executive | Daily, by user type | Is the store attracting new visitors or bringing existing ones back? |
| Bounce rate (13%) and bounce rate trend | Acquisition | UX | Session level, daily trend | What share of sessions leave without engaging, and is it improving? |
| Daily and weekly active users | User Engagement | Executive, Marketing | Daily (weekday vs. weekend), by day of week, weekly | How does activity change over time and by day of week? |
| Average session duration (3.39 min) | User Engagement | UX | Session level, daily trend by session type (purchase vs. view) | How long do visitors stay, and how do buyers differ from browsers? |
| Average events per session | User Engagement | UX | Session level, by session type | How deeply do visitors interact with the site? |
| Sessions by type and purchase sessions (1.35%) | User Engagement, Conversion | Executive, UX | Full period, session level | What share of sessions include a purchase? |
| Funnel: session start, add to cart, begin checkout (10.9% reach checkout start) | Conversion | UX, Marketing | Event counts, full period | Where do sessions stall on the way to checkout? |
| Funnel: begin checkout, shipping info, payment info, purchase (14.7% complete) | Conversion, Revenue | UX | Event counts, full period | Where do shoppers abandon checkout? |
| Purchase rate by session number | Conversion | Marketing, UX | By session number | Do repeat visits convert better than first visits? |
| Conversion rate trends (session start to checkout start, checkout start to purchase) | Conversion | UX, Executive | Daily | Is conversion improving over time? |
| Sessions by event name | Conversion | UX | By event name, full period | Which events occur in the most sessions? |
| Total revenue ($362,165) and quantity purchased (22,720) | Revenue | Executive, Merchandising | Full period, filterable | How much did the store earn and sell? |
| Revenue, quantity purchased and average price by category | Revenue | Merchandising | By product category, full period | Which categories draw volume, and which generate revenue? |
| Item funnel: begin checkout to purchase (137K items to 23K, 16.6%) | Revenue | Merchandising | Item level, full period | What share of items in checkout end up purchased? |
DAX measures
// Users table

Total Users =
DISTINCTCOUNT(FACT_Event[user_pseudo_id])

New Users =
CALCULATE(
    DISTINCTCOUNT(FACT_Event[user_pseudo_id]),
    FACT_Event[session_number] = 1
)

Returning Users =
CALCULATE(
    DISTINCTCOUNT(FACT_Event[user_pseudo_id]),
    FACT_Event[session_number] > 1
)

Returning User Rate =
DIVIDE([Returning Users], [Total Users])

// Sessions table

Total Sessions =
DISTINCTCOUNT(Sessions[Session_Key])

Engaged Sessions =
CALCULATE(
    DISTINCTCOUNT(Sessions[Session_Key]),
    Sessions[session_engaged] = 1
)

Bounce Rate =
DIVIDE([Total Sessions] - [Engaged Sessions], [Total Sessions])

Bounced Sessions =
CALCULATE([Total Sessions], Sessions[bounce_flag] = 1)

Bounce Rate 2 =
DIVIDE(
    CALCULATE(DISTINCTCOUNT(Sessions[session_key]), Sessions[bounce_flag] = 1),
    DISTINCTCOUNT(Sessions[session_key])
)

Purchasing Sessions =
CALCULATE(
    DISTINCTCOUNT(FACT_Event[Session_Key]),
    FACT_Event[event_name] = "purchase"
)

Purchase Rate =
DIVIDE([Purchasing Sessions], [Total Sessions])

Avg Sessions per User =
DIVIDE(
    DISTINCTCOUNT(Sessions[session_key]),
    DISTINCTCOUNT(Sessions[user_pseudo_id])
)

Avg Session Duration (min) =
AVERAGEX(
    Sessions,
    DATEDIFF(Sessions[session_start], Sessions[session_end], SECOND)
) / 60

StdDev Session Duration (min) =
STDEV.P(Sessions[Session Duration (min)])

// FACT_Event table

Distinct Users =
DISTINCTCOUNT(Fact_Event[user_pseudo_id])

Session Start to Checkout start Conversion Rate =
DIVIDE(
    CALCULATE(COUNT(FACT_Event[event_id]), FACT_Event[event_name] = "begin_checkout"),
    CALCULATE(COUNT(FACT_Event[event_id]), FACT_Event[event_name] = "session_start")
)

Checkout Start to Purchase Conversion Rate =
DIVIDE(
    CALCULATE(COUNT(FACT_Event[event_id]), FACT_Event[event_name] = "purchase"),
    CALCULATE(COUNT(FACT_Event[event_id]), FACT_Event[event_name] = "begin_checkout")
)

Purchase Events =
CALCULATE(COUNT(FACT_Event[event_id]), FACT_Event[event_name] = "purchase")

Page View Events =
CALCULATE(COUNT(FACT_Event[event_id]), FACT_Event[event_name] = "page_view")

Purchase per Page View Rate =
DIVIDE([Purchase Events], [Page View Events])

Items Viewed =
CALCULATE(
    COUNTROWS(Fact_Item),
    FACT_Event[event_name] = "view_item"
)

Items Added to Cart =
CALCULATE(
    COUNTROWS(Fact_Item),
    FACT_Event[event_name] = "add_to_cart"
)

Add to Cart Rate =
DIVIDE([Items Added to Cart], [Items Viewed])

// Fact_Item table

Quantity Viewed =
CALCULATE(SUM(Fact_Item[quantity]), FACT_Event[event_name] = "view_item")

Quantity Selected =
CALCULATE(SUM(Fact_Item[quantity]), FACT_Event[event_name] = "select_item")

Quantity Added to Cart =
CALCULATE(SUM(Fact_Item[quantity]), FACT_Event[event_name] = "add_to_cart")

Quantity at Checkout =
CALCULATE(SUM(Fact_Item[quantity]), FACT_Event[event_name] = "begin_checkout")

Quantity Purchased =
CALCULATE(SUM(Fact_Item[quantity]), FACT_Event[event_name] = "purchase")
SQL queries
FACT_Event table
SELECT
  -- fact table primary key
  TO_HEX(MD5(CONCAT(user_pseudo_id, CAST(event_timestamp AS STRING), event_name))) AS event_id,

  -- degenerate/session keys
  user_pseudo_id,
  CAST((SELECT value.int_value FROM UNNEST(event_params) WHERE key = 'ga_session_id') AS STRING) AS session_id,
  (SELECT value.int_value FROM UNNEST(event_params) WHERE key = 'ga_session_number') AS session_number,

  -- surrogate keys to dimension tables
  TO_HEX(MD5(CONCAT(
    IFNULL(device.category, ''), '|',
    IFNULL(device.mobile_brand_name, ''), '|',
    IFNULL(device.operating_system, ''), '|',
    IFNULL(device.language, ''), '|',
    IFNULL(device.web_info.browser, '')
  ))) AS device_key,

  TO_HEX(MD5(CONCAT(
    IFNULL(traffic_source.source, ''), '|',
    IFNULL(traffic_source.medium, ''), '|',
    IFNULL(traffic_source.name, '')
  ))) AS traffic_key,

  TO_HEX(MD5(CONCAT(
    IFNULL(geo.country, ''), '|',
    IFNULL(geo.region, ''), '|',
    IFNULL(geo.city, '')
  ))) AS geo_key,

  -- event info
  event_name,
  event_date,
  TIMESTAMP_MICROS(event_timestamp) AS event_timestamp,
  TIMESTAMP_MICROS(event_previous_timestamp) AS event_previous_timestamp,
  event_value_in_usd,
  (SELECT value.string_value FROM UNNEST(event_params) WHERE key = 'page_title') AS page_title,
  (SELECT value.string_value FROM UNNEST(event_params) WHERE key = 'page_location') AS page_location,
  (SELECT value.int_value FROM UNNEST(event_params) WHERE key = 'engagement_time_msec') AS engagement_time_msec,

  -- ecommerce measures
  ecommerce.transaction_id AS transaction_id,
  ecommerce.purchase_revenue_in_usd AS purchase_revenue_usd,
  ecommerce.refund_value_in_usd AS refund_value_usd,
  ecommerce.shipping_value_in_usd AS shipping_value_usd,
  ecommerce.tax_value_in_usd AS tax_value_usd,
  ecommerce.unique_items AS unique_items,
  ecommerce.total_item_quantity AS total_item_quantity,
  user_ltv.revenue AS user_ltv_revenue,

  -- stream, needed later to relate to items if you pull that fact table too
  CAST(stream_id AS STRING) AS stream_id

FROM `bigquery-public-data.ga4_obfuscated_sample_ecommerce.events_*`
Fact_Item table
SELECT
  TO_HEX(MD5(CONCAT(user_pseudo_id, CAST(event_timestamp AS STRING), event_name))) AS event_id,
  item.item_id,
  item.item_name,
  item.item_brand,
  item.item_variant,
  item.item_category,
  item.item_category2,
  item.item_category3,
  item.price_in_usd,
  item.quantity,
  item.item_revenue_in_usd,
  item.item_refund_in_usd,
  item.coupon,
  item.item_list_name,
  item.promotion_name

FROM `bigquery-public-data.ga4_obfuscated_sample_ecommerce.events_*`,
UNNEST(items) AS item
Sessions table
SELECT
  user_pseudo_id,
  session_id,
  session_number,
  user_pseudo_id || '-' || session_id AS session_key,

  MIN(event_timestamp) AS session_start,
  MAX(event_timestamp) AS session_end,
  COUNT(*) AS event_count,
  SUM(engagement_time_msec) AS total_engagement_time_msec,
  MAX(session_engaged) AS session_engaged,
  IF(COUNT(*) = 1, 1, 0) AS bounce_flag

FROM (
  SELECT
    user_pseudo_id,
    TIMESTAMP_MICROS(event_timestamp) AS event_timestamp,
    CAST((SELECT value.int_value FROM UNNEST(event_params) WHERE key = 'ga_session_id') AS STRING) AS session_id,
    (SELECT value.int_value FROM UNNEST(event_params) WHERE key = 'ga_session_number') AS session_number,
    (SELECT value.int_value FROM UNNEST(event_params) WHERE key = 'engagement_time_msec') AS engagement_time_msec,
    (SELECT value.int_value FROM UNNEST(event_params) WHERE key = 'session_engaged') AS session_engaged
  FROM `bigquery-public-data.ga4_obfuscated_sample_ecommerce.events_*`
)
GROUP BY user_pseudo_id, session_id, session_number
Users table
SELECT
  user_pseudo_id,
  ANY_VALUE(user_id) AS user_id,
  MIN(TIMESTAMP_MICROS(user_first_touch_timestamp)) AS user_first_touch_timestamp,
  MAX(user_ltv.revenue) AS user_ltv_max_revenue

FROM `bigquery-public-data.ga4_obfuscated_sample_ecommerce.events_*`
GROUP BY user_pseudo_id
Device table
SELECT
  device_key,
  ANY_VALUE(device_category) AS device_category,
  ANY_VALUE(mobile_brand_name) AS mobile_brand_name,
  ANY_VALUE(operating_system) AS operating_system,
  ANY_VALUE(device_language) AS device_language,
  ANY_VALUE(browser) AS browser
FROM (
  SELECT
    TO_HEX(MD5(CONCAT(
      IFNULL(device.category, ''), '|',
      IFNULL(device.mobile_brand_name, ''), '|',
      IFNULL(device.operating_system, ''), '|',
      IFNULL(device.language, ''), '|',
      IFNULL(device.web_info.browser, '')
    ))) AS device_key,
    device.category AS device_category,
    device.mobile_brand_name AS mobile_brand_name,
    device.operating_system AS operating_system,
    device.language AS device_language,
    device.web_info.browser AS browser
  FROM `bigquery-public-data.ga4_obfuscated_sample_ecommerce.events_*`
)
GROUP BY device_key
Traffic table
SELECT
  traffic_key,
  ANY_VALUE(traffic_source) AS traffic_source,
  ANY_VALUE(traffic_medium) AS traffic_medium,
  ANY_VALUE(traffic_campaign_name) AS traffic_campaign_name
FROM (
  SELECT
    TO_HEX(MD5(CONCAT(
      IFNULL(traffic_source.source, ''), '|',
      IFNULL(traffic_source.medium, ''), '|',
      IFNULL(traffic_source.name, '')
    ))) AS traffic_key,
    traffic_source.source AS traffic_source,
    traffic_source.medium AS traffic_medium,
    traffic_source.name AS traffic_campaign_name
  FROM `bigquery-public-data.ga4_obfuscated_sample_ecommerce.events_*`
)
GROUP BY traffic_key
Geo table
SELECT
  geo_key,
  ANY_VALUE(continent) AS continent,
  ANY_VALUE(country) AS country,
  ANY_VALUE(region) AS region,
  ANY_VALUE(city) AS city
FROM (
  SELECT
    TO_HEX(MD5(CONCAT(
      IFNULL(geo.country, ''), '|',
      IFNULL(geo.region, ''), '|',
      IFNULL(geo.city, '')
    ))) AS geo_key,
    geo.continent AS continent,
    geo.country AS country,
    geo.region AS region,
    geo.city AS city
  FROM `bigquery-public-data.ga4_obfuscated_sample_ecommerce.events_*`
)
GROUP BY geo_key